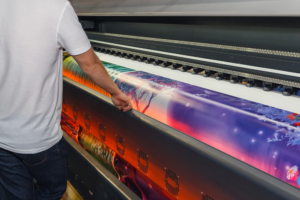
Cotton Management System & Process Control: A Case Study
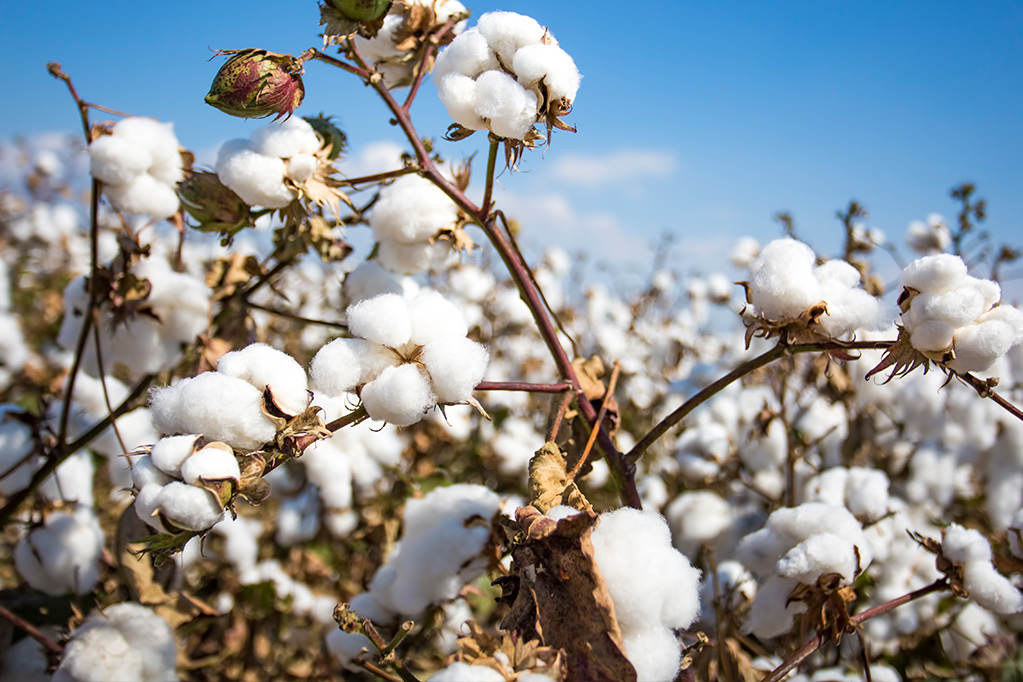
Cotton determines about 60 to 70 per cent of yarn manufacturing cost, working performance and desired yarn quality. Cotton procurement system and cotton sampling and testing methods are an integral part of the manufacturing process. This article highlights the authors experience and challenges in setting right the cotton management in toto to achieve the objective improve yarn quality and productivity in a large spinning mill.
Key factors debilitating yarn quality and the factory’s productivity were:
- Ineffective cotton procurement and sampling system
- High short fibre content (up to 45 per cent) and abnormal neps (up to 250) in procured cotton
- High short fibres in drawframe sliver (15 per cent) (after extracting 21 per cent noils in comber)
- Huge variation between available data and current test results
- Under-utilising fibre information systems/equipment in cotton procurement decisions and setting up process parameters
- Hard bales due to damaged/decomposed cotton

- Lower grade cotton with high trash content
- Ginners adding noils and false-packing bales
These factors were leading to:
- 3 per cent drop in yarn realisation
- 5 per cent reduction in GPS (production)
- High end-breaks and pneumafil waste
- 15 per cent increase in clearer-cuts
- High UKG
- Loss of repeat orders/market share

All the above losses accounted for 10 per cent erosion of the cotton’s purchase value (on a yearly basis).
Cotton Inspection & Sampling System
We redefined the whole process and introduced a cotton procurement/inspection policy, which created awareness among purchase personnel and end-users.
We Redefined the whole process
and introduced a cotton
procurement / inspection
policy, which created awareness
among purchase personnel and
end-users.
Results are:
- Cotton stations and ginners are selected only as per the cotton quality requirements
- Roller-ginned cotton is procured over saw ginned cotton. Roller-ginned cotton has better span length, uniformity, relatively less neps and short fibres than saw-ginned cotton
- Poorly-rated vendors, hard-bales (damaged/de-composed) suppliers are dropped/eliminated from the system
- Pass criteria: basic and bulk samples should match
- Cotton purchase personnel undergo training in all aspects – cotton testing, cotton-related practical issues faced by shop-floor personnel, etc.
- QA personnel inspect bales during unloading process.
About 70 per cent of the lots
showed abnormal difference
between SFC-N values for
the same lots.
As per the old practice, cotton samples for testing were collected from the surface of the bales by the contractor Thus, it was not a representative sample of the bulk lot. We revamped the cotton sampling system. Ensured
- 20 per cent sampling system is followed using representative samples method – 2 bales (visually bad-looking bales) are completely opened and two samples from centre portion of each bale covering top, middle and bottom portions are collected by QA personnel to test SFC-N and moisture %. SFC-N value fixed as one of the important criterias for selecting and passing cotton.
- Samples are collected in the remaining 18 bales in 10 bales from the centre, in four bales each from the top and bottom portions of the bales for testing other parameters.
Cotton Sampling System, Test Results and Yarn Quality
About 70 per cent of the lots showed abnormal difference between SFC-N values for the same lots. Current test results showed 35 per cent increase in SFC-N values than the old results for the same lots.
Old test results were from samples collected by old method – from the surface of the bales versus current test results from ‘Representative Samples Method’. Current test results were validated and found reliable. Thus, representative samples method became the decisive factor to build a reliable cotton-passing system leading to improved yarn quality and productivity.
Utilising Advanced Fibre Info Systems
The factory was not effectively utilising fibre data to improve quality and working performance. All technical personnel were coached – highlighting the importance of the system. We transformed the culture to 24×7 fibre data-driven manufacturing culture.

Manufacturing Process
Apart from revamping the cotton system,
- Standardised the soft waste re-usage % as:
- 1.5 per cent for fine counts
- 2.5 per cent for medium counts
- 3.5 per cent for coarse/medium carded counts
- Audited and standardised the process parameters and settings count-wise and respective machine-wise based on fibre data.
- Studied, analysed the quality of maintenance work done and its impact on product quality.
Conclusion and Results
- Clearer-cuts reduced by 25 per cent
- Reduced noils to 17 per cent from 21 per cent for the same quality level
- Reduced short fibres in draw frame sliver from 14.7 to 9 per cent
- Yarn realisation improved by 3.6 per cent
- 60s GPS increased by 13 per cent

Sarathy is a Project Leader at Texcoms Textile Solutions
Source: The Indian Textile Journal | May 2019 | 116-117